Embrace network visualization tools for more effective AML compliance in an increasingly complex financial world
By Dagan Osovlansky, ThetaRay Chief Product Officer
Fintechs and banks are struggling today to operate effective and efficient anti-money laundering (AML) and combating the financing of terrorism (CFT) programs, especially with the complexity of cross-border payments driven by new online platforms.
As digital payment velocity increases, AML compliance managers are exposed to enormous volumes of data.
To unravel complexity, big data analytics are becoming more essential for tracking money-laundering activities.
Bad actors continuously develop new modus operandi, changing criminal schemes faster than investigators can get on the trail of crime.
Indeed, today, the FATF is promoting the use of technology to implement a risk-based approach that can improve AML/CFT efforts. Specifically, according to the FATF, artificial intelligence-based tools can analyze data accurately and help better identify emerging risks. [add source]. Moreover, according to the FATF, technology has the potential to make efforts to combat money laundering and terrorist financing (AML/CFT) faster, cheaper, and more efficient.
Big data tools are also evolving alongside sophisticated machine learning. Technology can increase the capacity to collect and process data, and share it with stakeholders, including supervisors, notes the FATF.
Data visualization provides a powerful tool for AML professionals to gain insights to be able to effectively analyze and communicate data. Here are some benefits of visualization tools for AI-powered AML transaction monitoring:
Maximize the power of AI-generated data.
AI-powered technology for AML, especially “unsupervised” machine learning, learns the financial behavior of each customer, builds “normal” profiles, and detects unusual cases. In this way, hidden risks and “unknown unknown” typologies can be uncovered within the data. When the AI-processed data is analyzed and then visualized, the dots are connected, and discoveries are enriched, shedding new light onto abnormalities and enabling uncovering of new typologies in an increasingly complex financial world.
See the big picture.
Visualizations are more intuitive than text alone, and can therefore help provide context for red flags. Additionally, visualization can expose “hidden” suspicious patterns that cannot be revealed by alerts and/or transaction tabular representation.
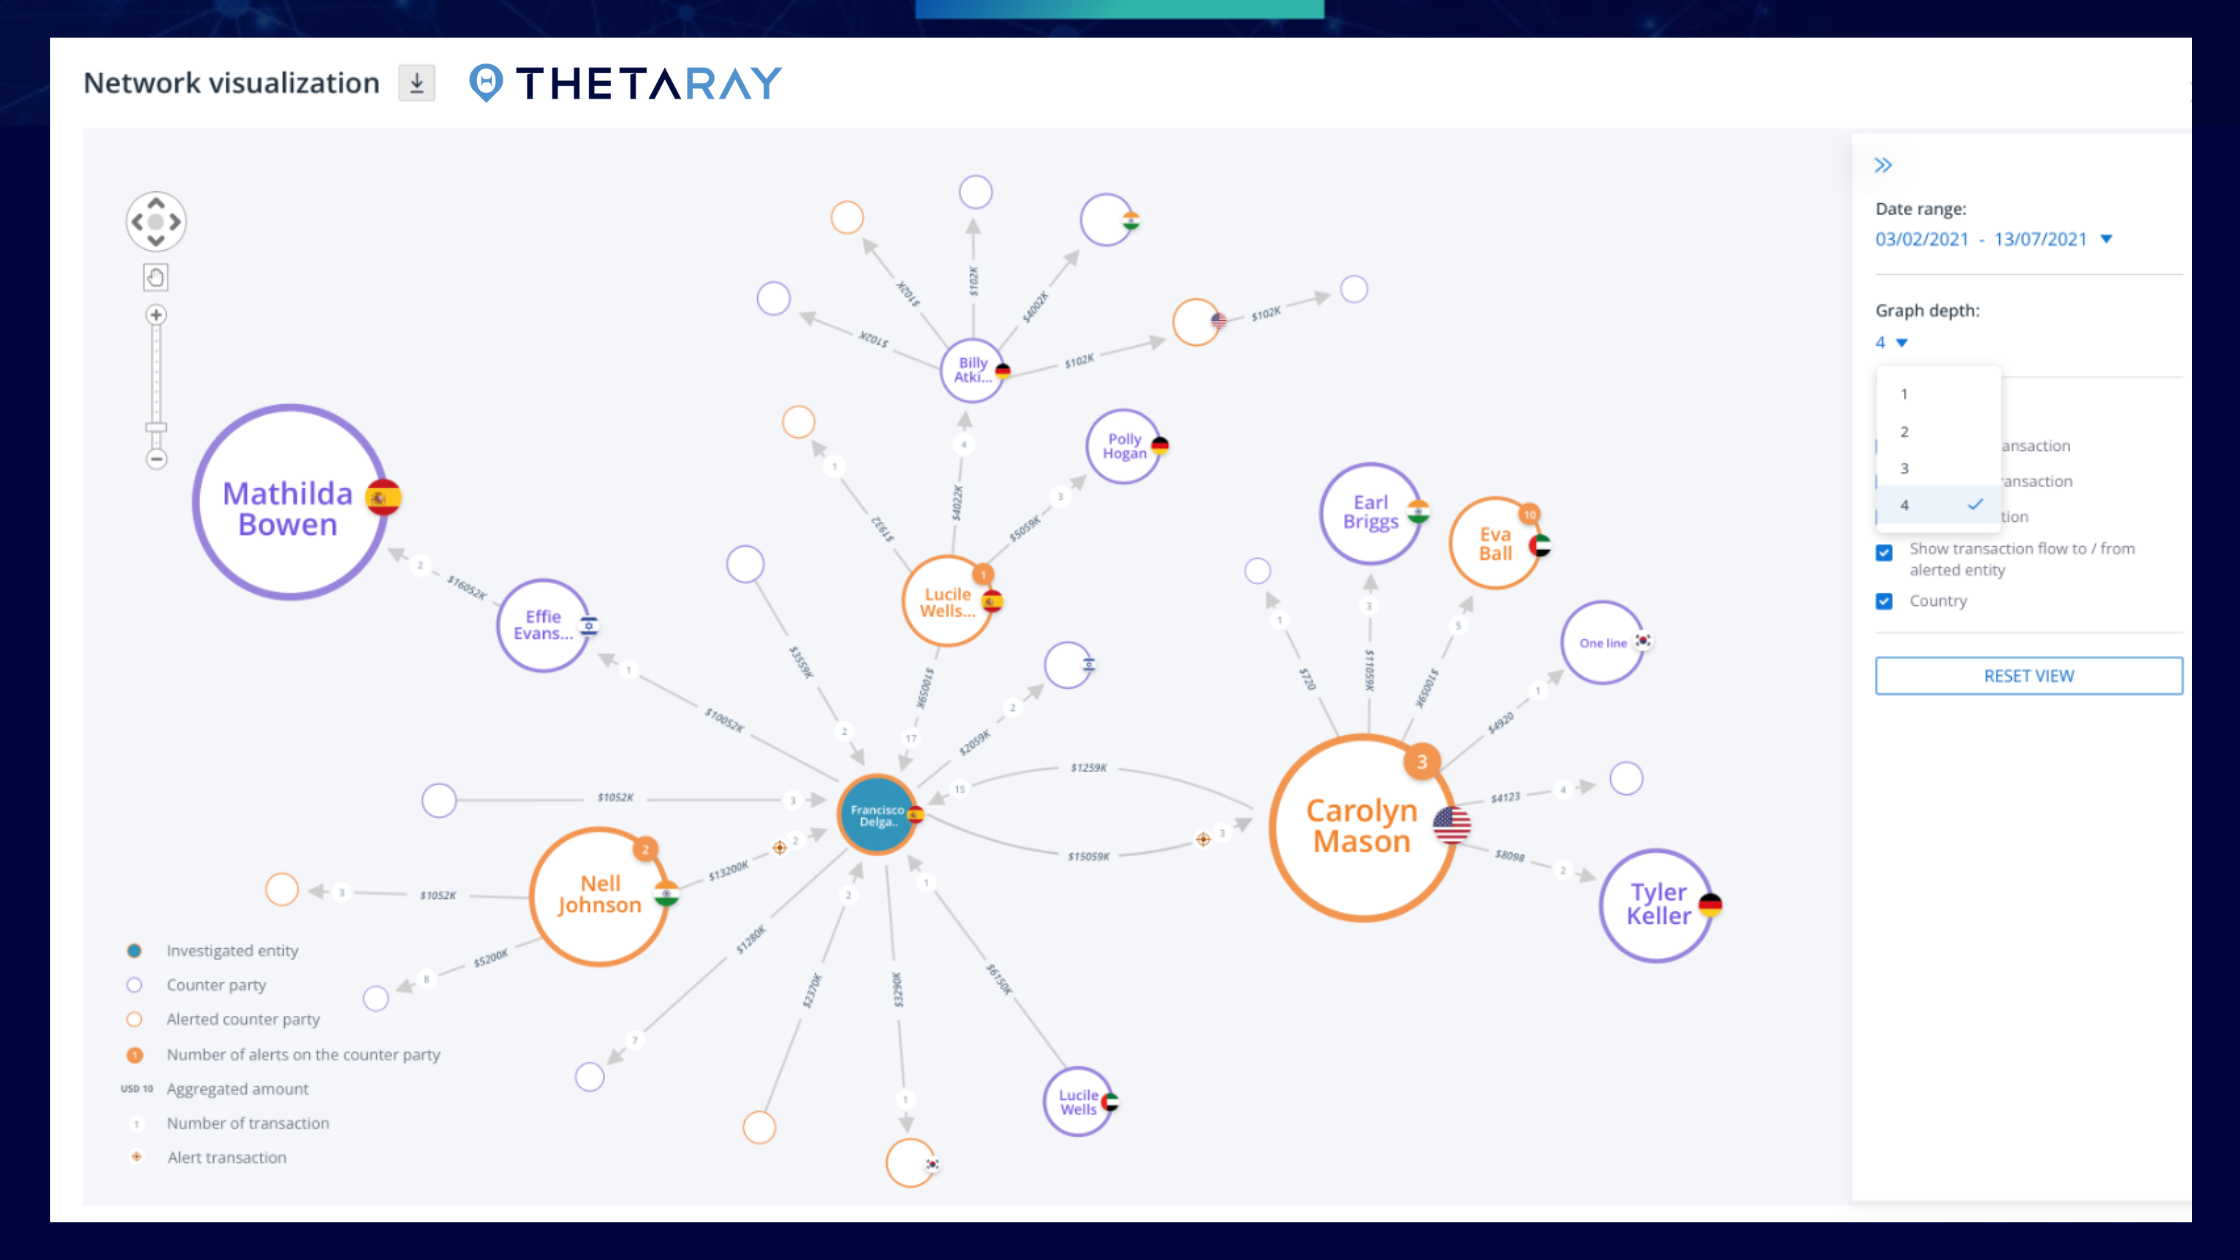
Using a visually mapping out financial network, AML compliance teams can thereby more easily explore relationships among different players, opening up the layers and revealing the source of activity from one to the next.
Enriching customer data with visualization helps deliver more accurate risk assessments, better decision-making, and fewer instances of false alerts.
Speed investigations.
The big picture enables faster and smarter decisions. Having network visualization as part of a machine learning ecosystem improves the investigation process, enabling faster investigations through clear and intuitive visualization of activity on financial networks.
Layers of the data behind alerts can be presented and analyzed graphically, including recipient names, the volume of transactions, payment timeline, aggregation of currencies, transaction direction, and country of origin.
When transactions can be easily and clearly viewed transactions across the networks, analysts and supervisors can see hundreds and thousands of transactions at one glance including interconnectivity with other entities. As a result, significant time and operating expenses can be saved on investigations.
Explain AI.
Visualization of AI models helps explain the decision-making behind machine learning methodologies. Regulators demand that ML models be as transparent as possible to be trusted.
When the layers of suspicious cases can be presented visually, it is easier to explain the AI-based discoveries in the data. In this way, visualization makes it easier to explain cases to non-experts, counterparts and authorities.
This is a huge advantage while working with regulators, as visual evidence of suspected patterns can assist in preparing SARs for regulators.
In sum, adding big data visualization tools to an AI-powered system can serve to strengthen the monitoring and reporting of suspicious transactions and thereby achieve faster and more accurate investigation of suspicious cases.